
Compounding Interest: The U.S. National Debt

Executive Summary
- U.S. government debt stands at roughly 100% of gross domestic product (GDP), a level reached under administrations of both parties.
- Net interest costs now consume more than 18% of tax revenues, near historically problematic levels, though little effort appears underway to contain them.
- Nations issuing a major reserve currency have historically been afforded considerably more leeway on borrowing capacity than others, but the precise limit is uncertain.
- Long-term Treasury yields have risen, but markets are not pricing a meaningful probability of default at this time.
- A gradual plan of modest annual deficit reduction could still stabilize the debt, but delay raises the cost of the eventual fix.
- Investors should consider diversifying exposures across bond sectors, inflation-linked securities, and non-dollar assets while such hedges remain inexpensive.
Rising Debt: A Bipartisan Phenomenon
“If we got one-tenth of what was promised to us in political speeches, there wouldn’t be any inducement to go to heaven.”
– Will Rogers
A small cottage industry exists online for the sole purpose of demonstrating how fast the U.S. national debt is growing.1 The counters tick upward in real time, by several thousands of dollars per second, and watching one for any length of time is a demoralizing experience. Several of these sites offer mobile applications, in the event that anyone wishes to carry that anxiety around with them when they are not around their desktop. Yet these apps are not strictly necessary given that the national debt has become a well-covered issue in the financial press.
The bad news is that the discounted net figure is now roughly on par with U.S. GDP, meaning federal debt held by the public is now roughly equal to the value of every good and service the world’s largest economy produces in a year (Exhibit 1).
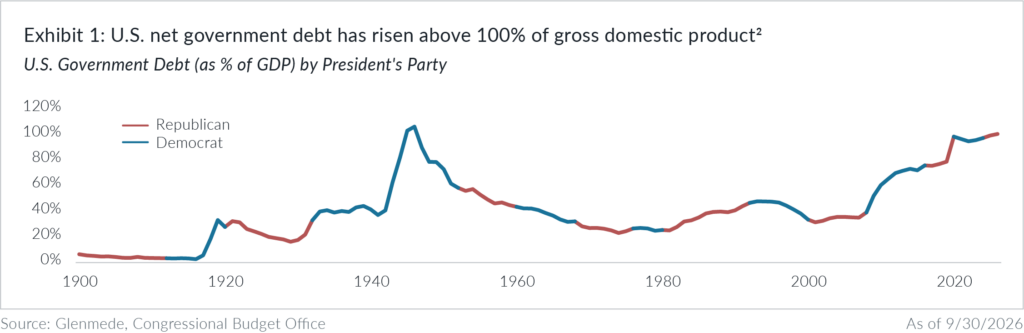
The expansion of the national debt may be the most bipartisan project of the past century. The line in Exhibit 1 has risen under Republican and Democrat presidents alike, and the episodes that moved it were hardly partisan initiatives.
What is more disheartening is that the institutional guardrails built to prevent this outcome have done a poor job of keeping the debt level on a leash. Federal spending requires agreement between the President and Congress through the annual appropriations process, and the statutory debt ceiling is supposed to stand as a separate constraint on borrowing. In practice, funding has frequently been provided through continuing resolutions, and the ceiling has been raised or suspended whenever necessary, with few serious efforts to address the underlying issue.
Part of the problem may be the incentives created by the four-year election cycle. An administration is judged on the economic conditions during its term and often bears little responsibility for the longer-term costs. When the objective is re-election or the continuation of party control, the incentive structure favors policies that win over votes today with future taxpayers expected to foot the bill.
Some of the major credit rating agencies have begun to pick up on this. Standard & Poor’s downgraded the U.S. from its highest rating in August 2011, Fitch followed in August 2023, and Moody’s lowered its own rating in May 2025. Taken alone, these actions are not particularly informative. These ratings are opinions formed on public information and rarely reveal anything market participants do not already know. What the downgrades do is intensify the discussion about when the debt will actually begin to matter, particularly what investors are charging to lend to the U.S. government and insure against its default.
The debt itself is large (and growing), the deficits producing it have persisted across administrations of both parties, and the machinery built to restrain them has been ineffective. At what point might this start to matter for markets?
Read moreRead less
Defining the Issue: Outspending Revenues
“Annual income twenty pounds, annual expenditure nineteen six, result happiness. Annual income twenty pounds, annual expenditure twenty pound ought and six, result misery.” – Charles Dickens’ Mr. Micawber in David Copperfield
The heart of the issue is rather simple, though the solution may be more difficult. The federal government collects revenues mostly from individual and corporate taxes, duties on imports, and charges for certain programs. It then spends those revenues on direct outlays and transfers to individuals, states, corporations, and other organizations according to legislated fiscal programs. However, the total amount collected falls well short of the total amount spent. This is essentially the case with most governments, not just the U.S.
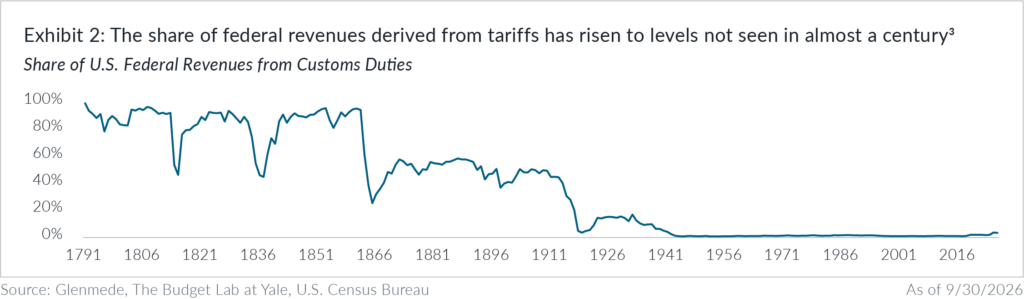
The stated purpose of the current tariff regime has been to rebalance trade relationships and protect industries of strategic national importance rather than to address the deficit, but extra revenue is an outcome regardless of intent. The Congressional Budget Office estimates that the program could reduce deficits by approximately $3 trillion over the next 10 years if it is kept in place as is.4
That final condition is pretty important. A meaningful share of duties already collected has been subject to refund following challenges in the courts, which has complicated the near-term receipts picture. Looking further out, however, the program now rests on firmer legal ground than it did. Following the Supreme Court’s ruling on the use of emergency economic powers, the program has shifted toward authorities with longer track records:
- Section 232 of the Trade Expansion Act of 1962, which permits import restrictions on national security grounds and was the basis for the steel and aluminum tariffs of 2018.
- Section 301 of the Trade Act of 1974, which permits action against unreasonable or discriminatory burdens on U.S. commerce and has been used against China.
Both have been exercised and litigated before, which makes duties imposed under them more difficult to unwind.
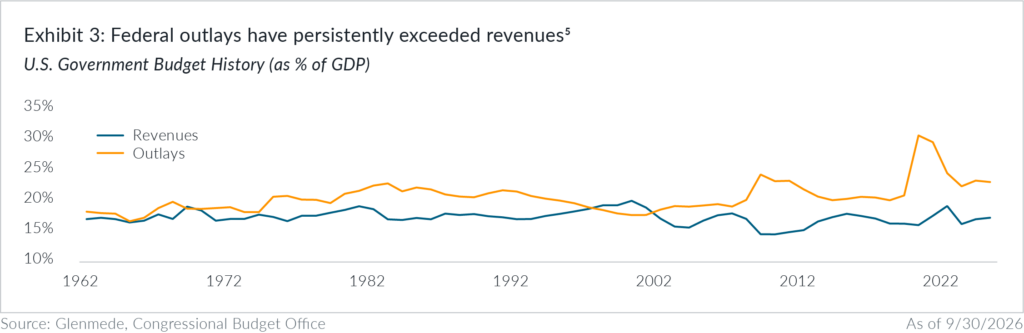
That additional revenue helps, but it does not nearly close the deficit gap because the gap is not primarily a revenue problem (Exhibit 3). Since 1962, federal revenues have oscillated within a fairly narrow band relative to the size of the economy. On the other hand, outlays have stepped higher in back-to-back economic crises since the turn of the millennium.
Governments that run a deficit and can borrow vast sums of money from investors use that borrowing power to fund their deficits, growing their debt outstanding. Debt and deficits then work in a reinforcing circle. As debt rises, so does the total interest owed on it, adding to government spending. That rising spending widens the deficit, leading to larger borrowing, more debt, and higher interest costs. Fluctuations in interest rates can accentuate or mitigate this recursive cycle.
Further, government debt can crowd out borrowing by other parts of the economy, such as municipalities, corporations, or even individuals, since there is a limited amount of funds seeking investment opportunities. In theory, crowding out such borrowing can reduce the ability of the economy to grow and impact the collection of tax revenues, the top line of the government’s budget. Separately, bond market investors can begin to shift their pricing of government debt, reacting to rising debt by requiring higher interest rates for their investment into government bonds.
The U.S. has recently been facing that overlap of influences, where accumulated debt and rising interest rates have worked together to drive the total interest cost on the national debt higher, both in absolute terms and as a share of tax revenues (Exhibit 4). Net interest consumed 18.5% of tax revenues in 2025, the highest since at least 1962, meaning almost one dollar in every five the federal government collected went straight to paying interest costs.
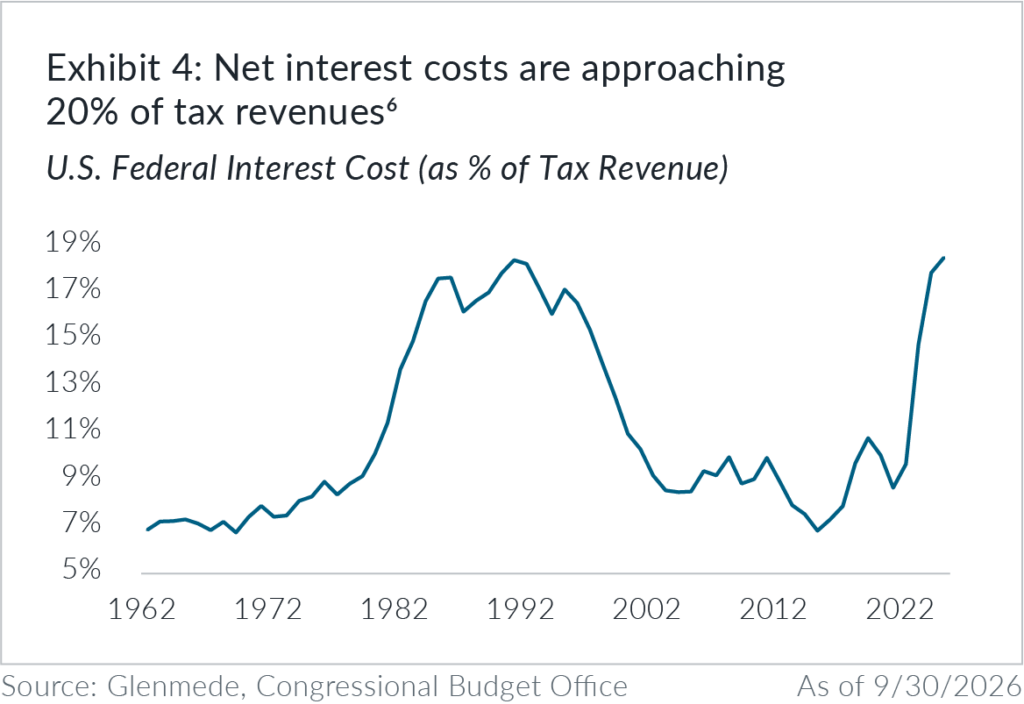
That level is also where Washington has historically started paying attention. The only prior episode in which interest costs approached a fifth of revenues ran from the mid-1980s into the early 1990s, and it produced a sustained run of consolidation legislation. The Social Security Amendments of 1983 raised the retirement age and subjected benefits to taxation for the first time. The Balanced Budget and Emergency Deficit Control Act of 1985 set declining deficit targets enforced by automatic spending cuts. The Budget Enforcement Act of 1990 replaced those targets with statutory caps on discretionary spending and a pay-as-you-go requirement for new entitlements and tax cuts. Interest costs fell back to 11% of revenues by 2000. The 20% level is being approached again without a comparable response, and little momentum appears to be building behind one.
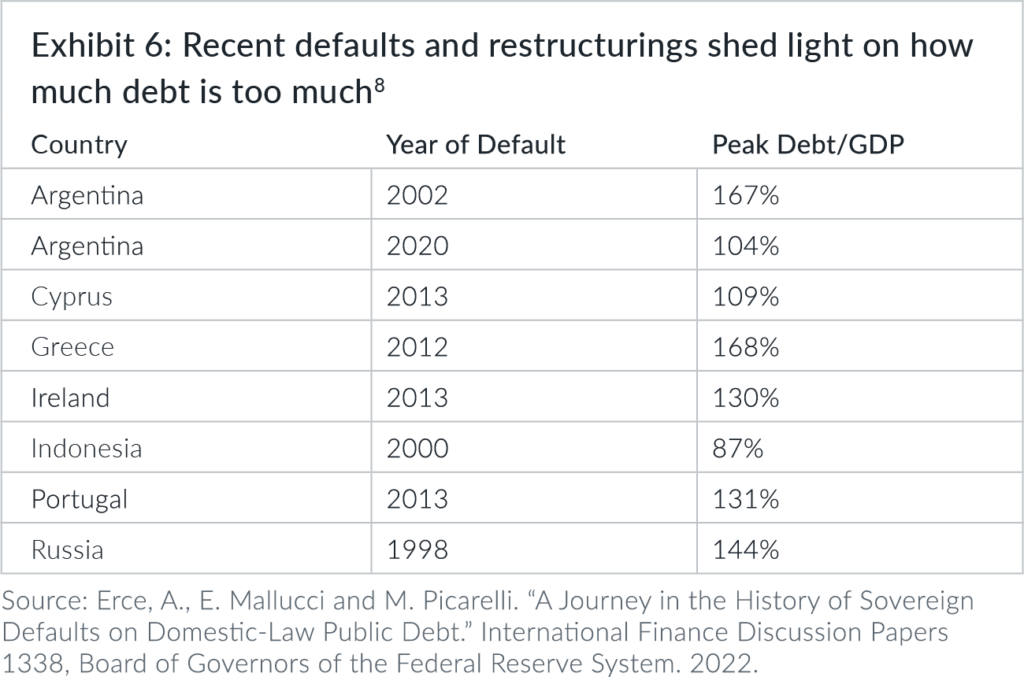
The deficit gap is structural, it is being met with increased borrowing, the cost of the borrowing has been increasing, and there has been little substantive initiative to do much about it. How much debt can a country such as the U.S. carry before it becomes untenable? History may be a guide.
Read moreRead less
History as a Guide
“Creditors have better memories than debtors.” – Benjamin Franklin
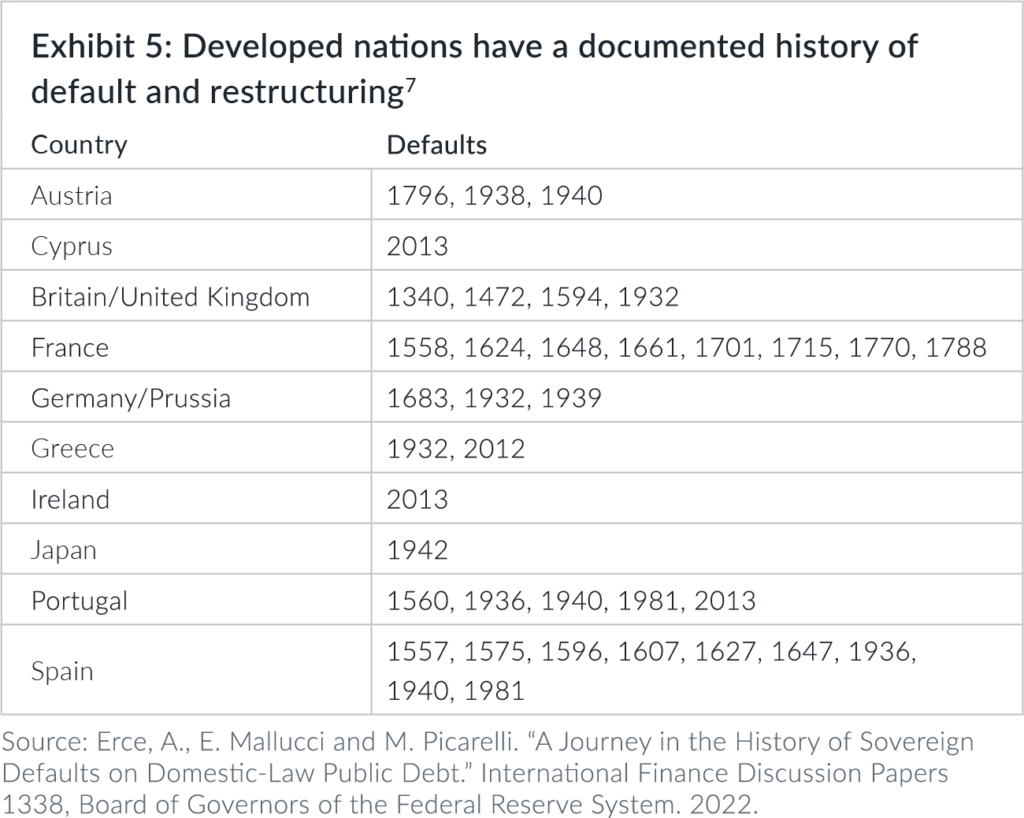
The urgency of addressing the U.S. national debt can be evaluated, at least in part, by considering the debt events of other nations. It is not unheard of for a significant nation-state to encounter difficulty with its finances. There is a documented history of developed nations defaulting on their debt or restructuring it into more favorable payment arrangements to pull themselves out of holes dug by excessive spending (Exhibit 5).
There is a case to be made that the U.S. may be a notable exception, separating it from every country on that list. None of them issued a currency widely used as a basis for international transactions, and many borrowed in currencies they did not control. History seems to show that developed economies whose governments operate and control a major world reserve currency have historically been afforded more leniency. A sovereign borrowing in a currency it does not issue faces a constraint that an issuer of its own currency does not: it cannot create the currency needed for repayment. This can give countries borrowing primarily in their own currencies considerably more flexibility, although it does not eliminate default risk. Two cases show the latitude that comes with reserve currency status, and the form the eventual adjustment took in each.
Read moreRead less
United Kingdom
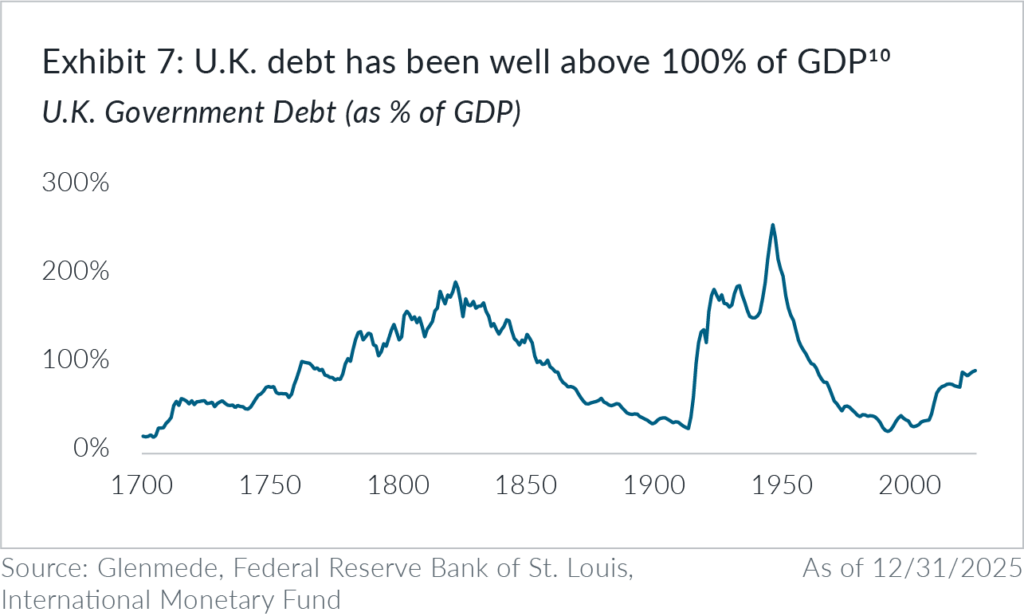
The U.K.’s debt has extended above 100% of GDP twice in the last 300 years, once during the late 1700s and again in the early-to-mid 1900s (Exhibit 7). The rise into the 1800s followed a series of wars over the prior 50+ years, including the Seven Years’ War, the American Revolutionary War, the French Revolutionary Wars, and the Napoleonic Wars. In the late 1800s, although debt service payments consumed close to 40% of annual government revenues, sustained economic growth coupled with an absence of further major conflict allowed the nation to reduce its debt gradually to roughly 35% by the beginning of the next century.
Any improvement in the fiscal situation was interrupted and essentially lost with the onset of World War II. At its start the U.K.’s debt was still above 150% of GDP, and the cost of that engagement drove it to a peak of ~260% in 1946. Through this period the U.K. was arguably the world’s leading empire and sterling the most prominent reserve currency of its time, which afforded far more capacity to borrow and endure than a smaller or emerging economy would have enjoyed. Using that capacity placed significant strain on the economy. The U.S., which bore less of the economic burden of the wars relative to the size of its growing economy, surpassed the U.K. in relative standing, and the dollar assumed its current position as the leading world reserve currency.
How the U.K. worked that debt down is the part most relevant to a reserve currency issuer today. The ratio fell from 259% in 1946 to under 60% by 1970, and the mechanism was not default. It was a long stretch in which nominal growth and inflation outran the coupons on debt issued at wartime yields. The U.K. introduced index-linked gilts in 1981, after a further inflationary decade, which was the first time a major developed sovereign offered investors an explicit hedge to purchasing power risk.
Read moreRead less
Japan
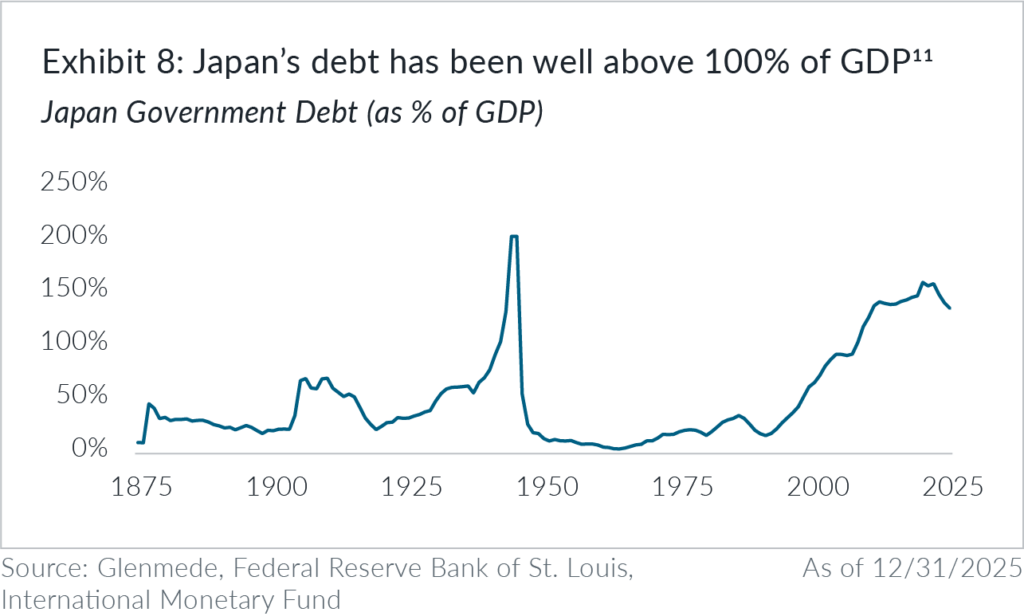
Japan has experienced a similarly significant capacity to borrow (Exhibit 8). Its status as a leading nation and the yen’s place as a top world currency have afforded it the ability to increase its borrowing substantially relative to the size of its economy. The first period was, as in Britain, during World War II, when debt reached more than 200% of GDP. Unlike Britain, Japan did not gradually bring that balance down over the following decades. Immediately after the war the Japanese government introduced a war indemnity special tax, imposing a 100% levy on amounts paid on war indemnities, exchanged the old yen for a new yen, froze bank deposits, and conducted a property investigation for the purpose of confiscation. The Bank of Japan printed large quantities of bank notes, which drove inflation up and sharply reduced the real value of previously issued bonds and the interest paid on them. Debt fell from above 200% of GDP to 14% by 1950.
More recently, Japan’s net debt rose through the decades following the 1990 peak and now stands at roughly 137% of GDP. Its central bank kept interest rates and inflation generally low for most of that stretch, buying decades of time to address an ailing economy. The ability to sustain that level has surprised many observers, but it appears rooted in the yen’s status as a reserve currency and the share of government debt held by individuals, corporations, and institutions inside Japan’s own borders.
Read moreRead less
United States
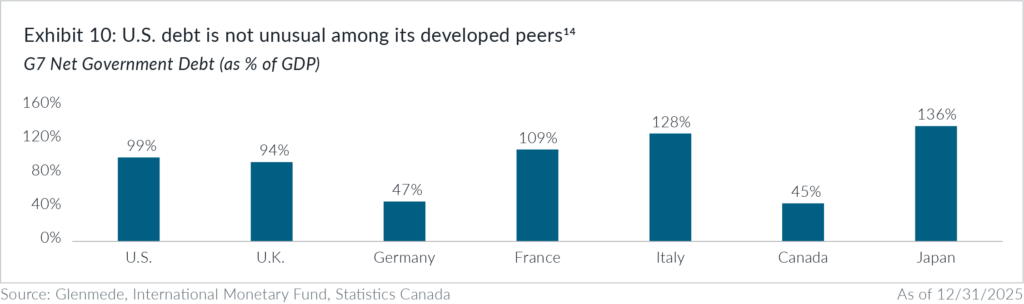
The U.S. has had its own brush with extreme accumulations of debt (Exhibit 9). Like other Allied nations during World War II, it incurred substantial costs both during and after the conflict, when it contributed heavily to rebuilding efforts and allowed the restructuring of a number of countries’ wartime debts at its own expense. Debt peaked modestly above 100% of GDP in 1946. Afterward the balance declined relative to the size of the economy, reaching 23% by 1974, partly as a function of fiscal constraint but mostly due to postwar growth in the domestic and global economies. Still, these three observations provide some substantiation that the limits are higher for a country occupying a leading spot on the global stage with authority over a world reserve currency. The number of situations in which this has been tested is small, which leaves an imprecise estimate of where the limits sit. Experts at the Penn Wharton Budget Model have estimated that U.S. debt held by the public cannot exceed roughly 200% of GDP without destabilizing consequences, though the roundness of that figure illustrates their own uncertainty about the exact red line.13 Another consideration is that we live in a relative world almost as much as we do in an absolute one (Exhibit 10). The current magnitude of U.S. government debt is high by historical standards but not too dissimilar to its peers on the global stage, sitting below France, Italy, and Japan. The U.S. is often thought of as one of the cleaner dirty shirts in the laundry basket, which is to say one of the shirts still chosen when no clean shirts are available. There is large and persistent demand for fixed income to counterbalance equity allocations and to match fixed-term liabilities such as the payments made by large insurance companies, and such demand tends to find its way to the largest and most liquid options available. The historical record provides some answers but is not completely prescriptive. It suggests that the limits are higher for a reserve currency issuer, though the sample size of data establishing that thesis is small. In addition, the estimate of the level at which debt accumulation begins to matter is imprecise enough that it is difficult to draw a red line. What the record does show is that the adjustments can take different forms, from fiscal austerity, higher inflation, stronger economic growth, or any combination thereof. While historical precedents are helpful, one can argue that each crisis is a sample size of one. What might markets, which continuously price these risks, be signaling about the current backdrop?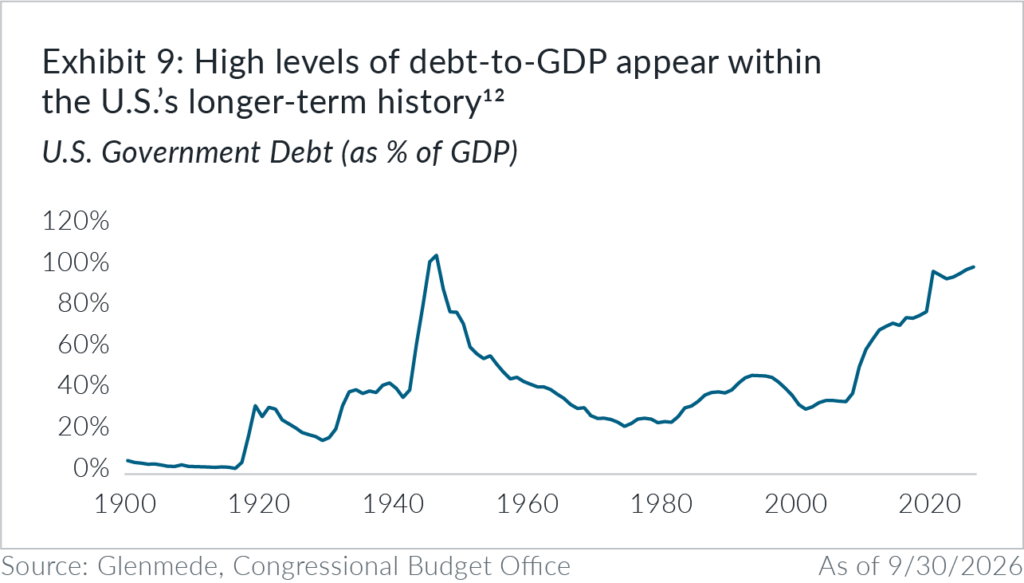
Read moreRead less
Signals from Markets
“I used to think that if there was reincarnation, I wanted to come back as the President or the Pope or as a .400 baseball hitter. But now I would like to come back as the bond market. You can intimidate everybody.” – James Carville
Yields on long-dated Treasuries have risen substantially since the Covid-19 pandemic, and the rise is frequently attributed to concern about the U.S. government’s debt. It is a reasonable instinct to connect the two as a clean cause-and-effect relationship, but the data do not support that thesis. The bond markets can tell you a lot about how investors are perceiving various risks and likelihoods if you know where to look.
Consistent with that framework, 10-year U.S. Treasury yields rose a little more than 1% over the first nine months of 2026 (Exhibit 11). Contrary to popular belief, and despite the rising cost of energy resulting from geopolitical conflict, forward-looking inflation expectations had not moved materially higher. This is readily observable from metrics such as breakeven rates from Treasury Inflation-Protected Securities (TIPS) and inflation swaps, which both gave roughly the same signal of relatively anchored inflation expectations. Instead, real rates and the term premium were responsible for the vast majority of the increase in yields.
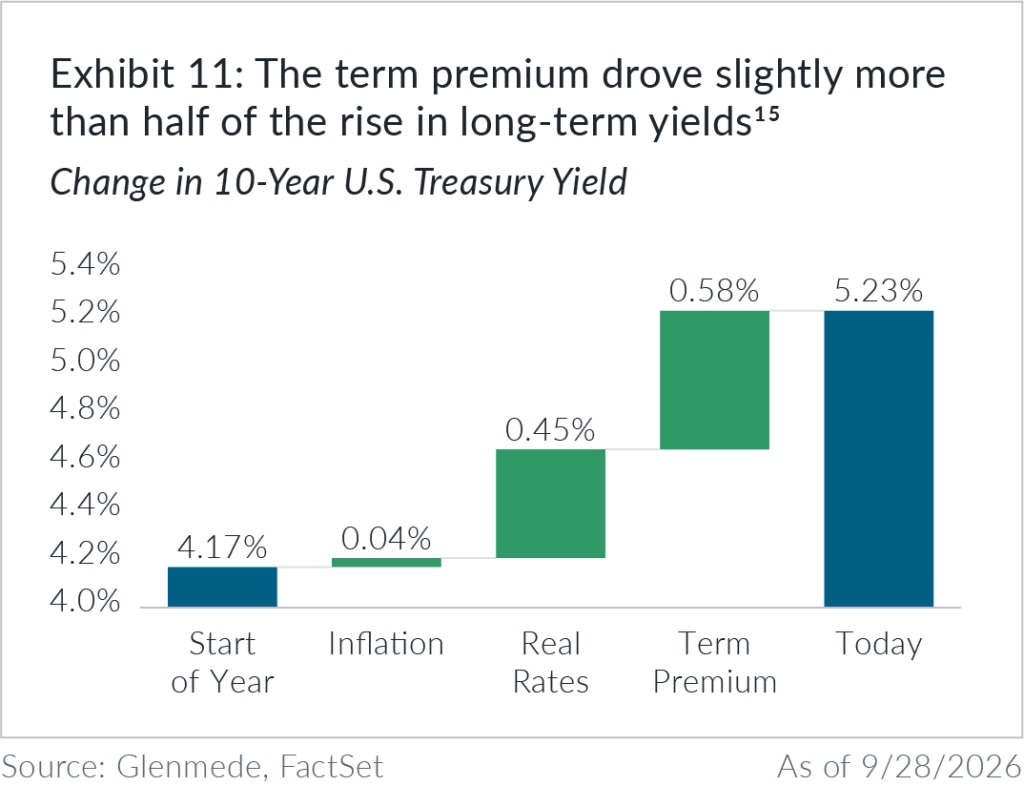
The increase associated with real rates is understandable, given that markets had to notably readjust their projections on the path for Fed policy. Fed funds futures were pricing in rate cuts as the most likely outcome at the start of 2026, which later gave way to expectations for several rate hikes instead.
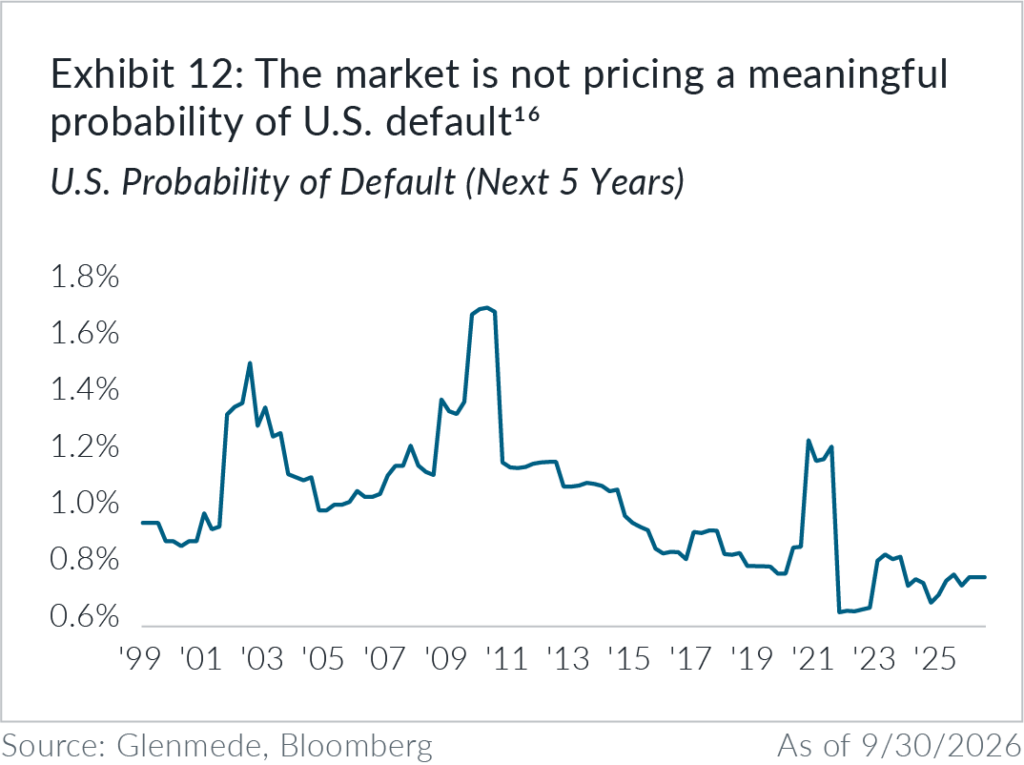
On the other hand, the driving factor behind the rising term premium has been less easy to pin down. It is rhetorically easy to point to a higher probability of default on the federal government’s debt as the cause, which would be consistent with a burgeoning debt burden. However, markets show little concern about the short- to medium-term likelihood of a default event on U.S. debt (Exhibit 12).
There are several other explanations that could be behind the rising term premium, and the truth may lie somewhere across several of these factors:
- Fed balance sheet normalization: Ever since the onset of the Great Financial Crisis (GFC) in 2008/2009, the Federal Reserve has played a proactive role in stabilizing long-term interest rates with its balance sheet policy. Under the leadership of Chair Kevin Warsh, the Fed appears to be moving in the other direction, which so far has involved ceasing net purchases of securities and shortening the maturity profile of its existing Treasury holdings. Going forward, there may be more serious discussions regarding outright shrinking the size of the Fed’s balance sheet, which in practice would mean less demand for longer maturity Treasuries from one of its biggest buyers over the last 20 years.
- Removal of forward Fed guidance: Another initiative of Warsh’s nascent chairmanship has been a reluctance to guide markets toward the Fed’s next course of action. In practice, this has meant more volatility for bond markets around Fed decision days. Generally, investors seek to be compensated for taking on additional risk, and that compensation could show up in a higher term premium.
- Stronger economic growth: In the decades prior to the Fed’s active post-GFC role in Treasury markets, a steepening yield curve was often interpreted as a sign of strengthening economic growth prospects. This was essentially the other side of a more famous phenomenon, where a flattening (or inverted) yield curve has come to be interpreted as a warning of a slowing economy or impending recession. The recent steepening in the term premium may be partly a reflection of the higher economic growth prospects boosted by massive artificial intelligence (AI) infrastructure deployment.
- Competition for capital: While the federal government is financing its deficits with additional borrowing, companies have been increasingly tapping the debt markets to finance the buildout of AI infrastructure. If the supply of financial assets grows faster than the pool of available savings (which it has, as household saving rates sit near multi-year lows), asset prices may need to adjust lower to attract sufficient investor demand. For bonds, those lower prices show up as higher yields and are likely a notable contributor to the rising term premium.
None of this means the debt does not matter. It means investors are not imminently worried about getting paid back, which is a different thing entirely. Markets have given the U.S. government the benefit of the doubt so far. That benefit is only worth something if the time it buys is used effectively to get the debt under control. This naturally leads to the harder question of what it would take to actually stabilize the debt, and whether any of the available options can do it without breaking something else along the way.
Read moreRead less
In Search of a Solution
“Everybody is in favor of general economy and particular spending.” – Anthony Eden
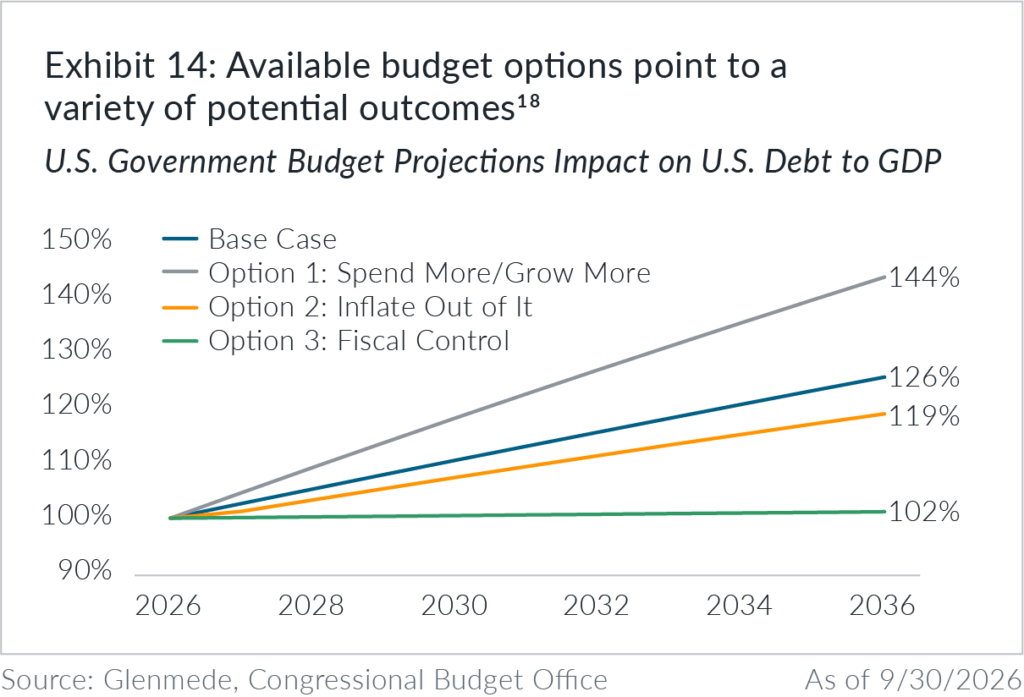
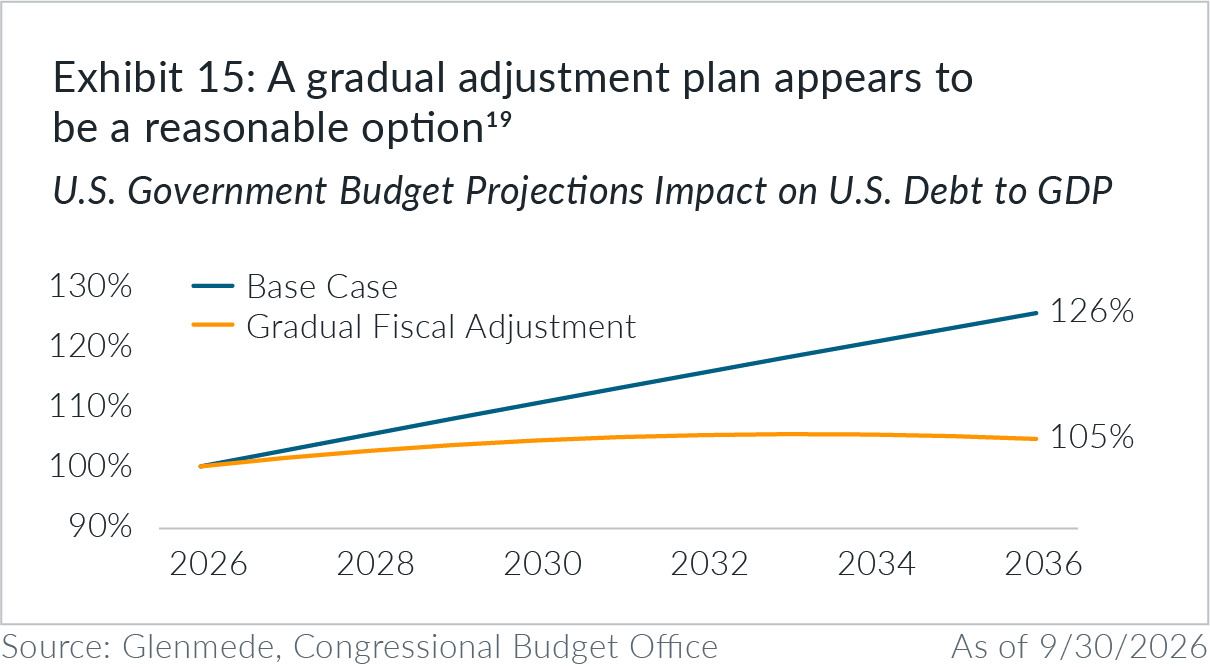
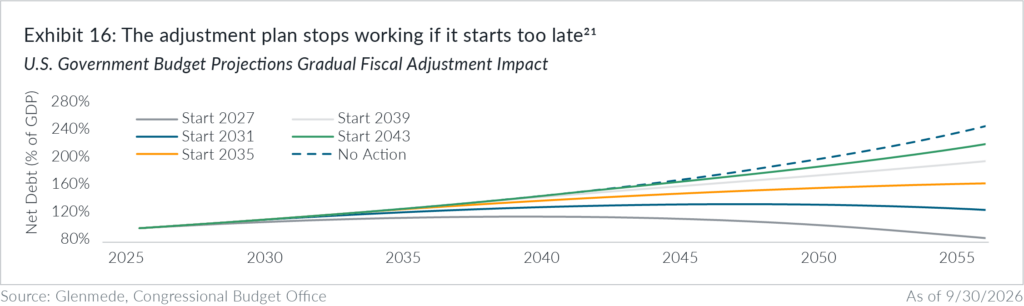
While the amount of debt that a leading nation with a prominent reserve currency can sustainably carry is uncertain, history suggests that pushing debt toward extreme levels can have adverse long-term economic consequences. Current projections from the Congressional Budget Office show that legislation, spending patterns, and growth in the economy are currently expected to lead to ongoing deficits and a continued steady climb in U.S. debt relative to the size of the economy (Exhibit 13). A second key observation from the examples of the U.K., Japan, and the U.S. is that a country that exhibits an ability to stabilize its debt-to-GDP ratio is afforded the leeway of time by markets. But that leeway should not be interpreted as carte blanche to continue on that path indefinitely. To that end, it is worth exploring various options that politicians and economists have proposed to solve the problem (Exhibit 14). Option 1 (Spend More/Grow More) attempts to lift the economy through increased deficit spending, with the stated goal of having that spending boost economic output at a rate that exceeds the cost of the expense itself. While different types of government spending have varied multiplier effects on economic growth, the solution is more likely to have the opposite effect from what is intended. Unless each dollar spent magically drives disproportionately efficient productivity and economic growth, debt accumulates and compounds faster than the growth of the economy, driving debt-to-GDP up at a faster pace. In Option 2 (Inflate Out of It), the U.S. government attempts to use the power of its central bank to drive up inflation, pushing the nominal size of the economy up at a faster pace than the growing debt balance. While that may sound great in theory, markets are likely to quickly recognize that inflation is running higher and reprice yields on longer-term bonds in reaction to higher inflation expectations, nullifying the impact. That is to say nothing of the tremendous political and social costs that come along with general deterioration in the standard of living. Runaway inflation also hampers economic growth through “menu costs,” which force businesses to devote time and resources to frequently adjusting prices rather than producing goods and services. History has shown time and again the folly of inflating one’s way out of debt. Nevertheless, if this is a path taken, it generally appears to be an insufficient solution even if bond markets do not reprice accordingly. In Option 3 (Fiscal Control), the government instantly adjusts its spending plans. This appears to have the most direct and lasting impact, but the interaction between government spending and the economy is uncertain. Also, such an immediate shift could weaken the economy and prove quite painful for the average company and individual. Alternatively, a more gradual plan appears the most plausible and the least likely to cause a shock to the entire system (Exhibit 15). Under such a plan, instead of implementing a complete stop to deficit spending, the U.S. government could, for example, set in motion a sequence of more modest reductions in spending relative to the size of the economy, around 0.25% per year. Debt would still increase in the first few years but would likely level off relative to GDP and could eventually begin to decline once economic growth surpasses the magnitude of deficit spending. The gradual implementation of spending reductions would likely limit the impact of such actions in any given year. In addition, short-term interest rates could be held marginally lower than longer-term targets, approximately 0.25% to 0.5%, via interest rate suppression from the central bank, potentially accompanied by marginally higher inflation targets of a similar magnitude. But such combinations should be explored and implemented only gradually so as not to shock the system or create unintended consequences. Yet such a course of action requires the political will to begin that process, as well as to maintain it over time. The gradual plan in Exhibit 15 assumes the adjustment begins immediately, which may not be politically realistic. But there are costs to kicking the can down the road, since it allows the debt to grow larger and interest payments to balloon to an ever-larger share of the government’s budget. In addition, the academic literature suggests that interest rates themselves should increase as well, with a roughly 0.03% increase in borrowing costs for every extra 1% of debt-to-GDP.20 Even though that appears relatively small, it can compound into significantly larger debt servicing costs over time. The longer policymakers hold off before making such adjustments, the more difficult it will be to bend the debt-to-GDP projection curve. The concept is similar to the physics around black holes. Because they have tremendous gravitational pull, escaping their grasp requires moving faster than the pull; as for debt piles, the pull strengthens as the interest costs grow. And at some point, one hits the “event horizon,” the point after which there is no return. At what point does the gradual adjustment plan no longer suffice to bring the debt back on a reasonable track? Glenmede’s analysis suggests that the point of no return is still roughly a decade away (Exhibit 16). However, the analysis is admittedly simplistic and does not allow for potential disruptions that may temporarily blow out the budget, including recessions or spendthrift politicians. Given the fact that budget shocks are disproportionately more likely to show up as shortfalls rather than windfalls, that timeline may tilt optimistic. But the most important takeaway is that delaying action is not without its costs. The longer policymakers wait to address the issue, the more economic pain the solution is likely to incur. Meaningful spending reduction could require adjustments to programs with broad public support. It should not be surprising that, when asked, people are in favor of financial responsibility but may not be quite as pleased when they see the programs that benefit them get cut. In short, history and simple budget modeling suggest that addressing excessive debt likely requires some combination of spending restraint, economic growth, and modest inflation, implemented gradually enough to limit the risk of an economic shock. That option remains available today. Whether it is taken is a political question. Nevertheless, investors should seek to build resilient portfolios that can help withstand the consequences in the event the course is not sufficiently corrected.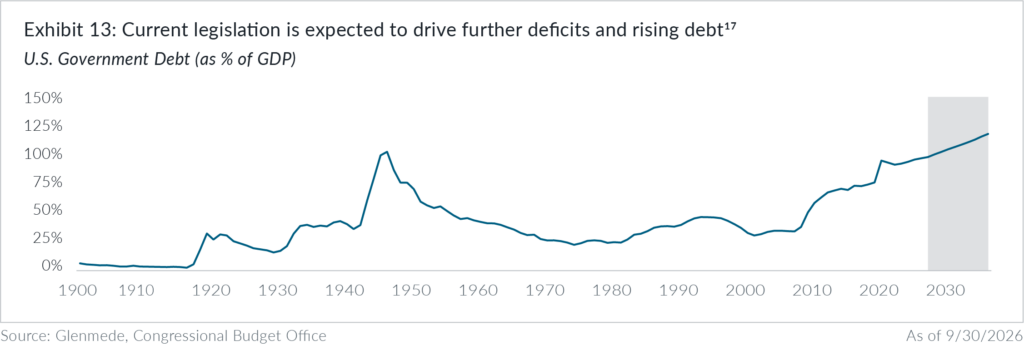
Read moreRead less
Implications for Investors
“One who, fully prepared, awaits the unprepared will be victorious.” – Sun Tzu
Investors should delay making sudden judgments about the sustainability of the U.S. government’s ability to pay its debt in the near to intermediate future, or about where interest rates should sit. The government has accumulated a large amount of debt, but it remains a preferred investment-grade credit for global investors, with an extraordinarily deep market for its bonds and the world’s reserve currency behind it.
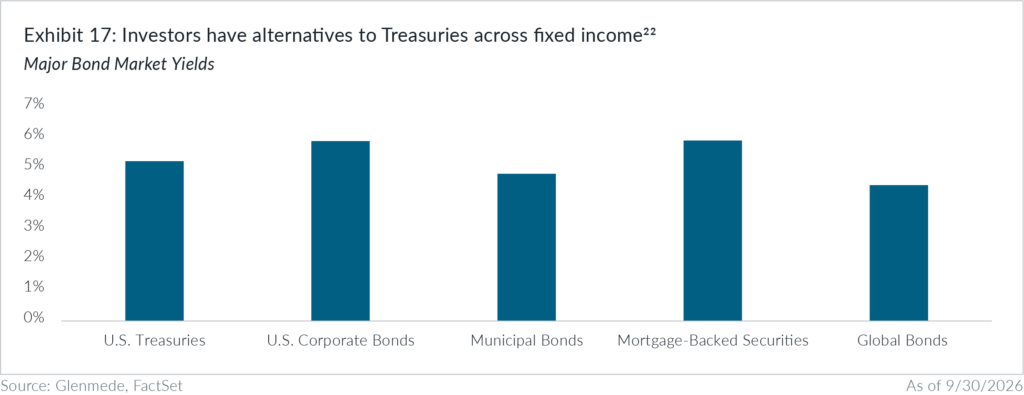
A glance across fixed income shows that alternatives exist, each with its own degree of separation from federal government finances, and several offering higher yields (Exhibit 17). For tax-exempt investors, investment-grade corporate bonds, mortgage-backed securities, and global bonds are viable options. Higher yields on some of these reflect, in part, compensation for assuming issuer-specific credit risk rather than U.S. government credit risk. For taxable investors, municipal bonds, backed by the financial position of U.S. states, cities, municipalities, and government-related projects, provide a similarly competitive opportunity, with lower yields than Treasuries but preferred tax treatment at the federal and potentially state level, depending on the investor’s location.
These alternatives come with qualifications, because every one of these instruments is theoretically priced off a Treasury baseline. If the base discount rate reacts to sovereign credit concerns, that repricing should theoretically ripple through to every domestic fixed-rate bond regardless of who issued it, and credit spreads have historically widened rather than compressed when the sovereign comes under stress.
That relationship is not necessarily fixed, though, and France has offered a live demonstration this year. Amid concern about French public finances, roughly 38% of French investment-grade corporate bonds at one point yielded less than maturity-matched government equivalents.23 Essentially, investors treated a large share of the country’s companies as better credits than the country itself. The assumption that the sovereign is the risk-free anchor and corporate borrowers sit above it is a convention rather than an immutable law.
Within domestic bond sectors, there may be certain linkages that are worth appreciating. For example, some agency mortgage-backed securities carry an explicit federal backstop, which makes them closer to a government proxy than to a diversifier of government risk. Municipals also carry some fiscal linkages of their own, since state and local finances depend materially on federal transfers. Against that, the value of the tax exemption rises with marginal tax rates, so municipals offer a partial hedge if the eventual adjustment runs through higher taxes rather than reduced spending. Corporate credit may also be exposed through bank balance sheets and the role of Treasuries as collateral.
The case for diversifying the fixed income portion of portfolios rests on an assumption that inflation expectations remain contained. If those expectations de-anchor, the case weakens considerably, because the loss is then denominated in the currency and every nominal dollar claim will be exposed to the resulting loss of purchasing power. Inflation-linked Treasuries may help address this issue, though they do remain obligations of the same issuer.
Assets denominated in non-dollar currencies play an important role in diversification, and even more so in a hypothetical U.S. debt crisis. Global bonds, also investment grade, carry a lower current yield given how yields are priced internationally, but they pay in other currencies. International equities share that feature and should be part of a balanced stock allocation. So does a modest allocation to gold, assuming it is not egregiously priced at the time of purchase.
There may be second-order effects for most portfolios beyond these factors. Higher Treasury yields could raise the rates used to discount future cash flows, and the further out those cash flows sit, the more their present value falls. Long duration equities such as growth stocks could bear the brunt of that effect.
Many of these options are quite viable for taxable and tax-exempt investors and may warrant review with an advisor. While not immediately necessary for protection against some imminent financial event, they offer the benefit of diversification of exposures, which when the time for such worries comes will be considered far more valuable than they are today.
Read moreRead less
1 www.usdebtclock.org is a good one. Information obtained from third-party sources is assumed to be reliable but may not be independently verified, and the accuracy thereof is not guaranteed.
2 Shown is U.S. government debt as a percent of gross domestic product (GDP), a measure of overall economic activity. U.S. government debt includes publicly held debt and excludes the portion of public debt held within the government by agencies or government trust funds, such as those for Social Security, for periods after 1980. The line is colored red during calendar years in which a Republican president occupied the White House for the majority of the year and blue for Democrats. The figure for 2026 reflects the latest estimate from the Congressional Budget Office. Actual results may differ materially from estimates. Glenmede strives for a nonpartisan approach to its political coverage.
3 Shown is the share of U.S. federal government revenues derived from customs duties. Figures for 2026 are as of the latest date shown.
4 Swagel, Phillip, “An Update About CBO’s Projections of the Budgetary Effects of Tariffs,” CBO Blog, Congressional Budget Office, August 22, 2025, https://www.cbo.gov/publication/61697.
5 Shown are total revenues and total outlays for the U.S. government as a percentage of gross domestic product (GDP), a measure of overall economic activity. Revenues are funds the federal government collects from the public using its sovereign power, such as individual income taxes, corporate income taxes, social insurance taxes, duties on imported goods, various fees, and fines. Outlays are checks, disbursed cash, or electronic transfers from a federal agency that fulfill a federal spending obligation or reimbursement associated with either discretionary spending programs such as defense spending or mandatory spending programs such as federal benefit programs and other payments to individuals, businesses, nonprofit institutions, and state and local governments.
6 Shown are net interest costs, total interest paid minus interest received, as a percent of tax revenues collected each year.
7 The table shows a list of years in which each nation defaulted on their debt by not making a repayment or restructuring their debt in order to avoid a default.
8 Data shown represent government debt as a percent of gross domestic product (GDP), a measure of overall economic activity, for select developed or very large emerging market nations that have defaulted on or restructured their national debt within the last 30 years.
9 Reinhart, Carmen A., and Kenneth S. Rogoff, This Time Is Different: Eight Centuries of Financial Folly (Princeton, NJ: Princeton University Press, 2009).
10 Data shown represent government debt as a percent of gross domestic product (GDP) for the U.K. for periods after its formation in 1800 and for Great Britain prior to and including 1800. Government debt includes publicly held debt and excludes the portion of public debt held within the government by other inter-governmental agencies or divisions for periods after 1980.
11 Data shown represent Japan’s government debt as a percentage of gross domestic product (GDP). Government debt includes publicly held debt and excludes the portion of public debt held within the government by other inter-governmental agencies or divisions for periods after 1980.
12 Shown is U.S. government debt as a percent of gross domestic product (GDP), a measure of overall economic activity. U.S. government debt includes publicly held debt and excludes the portion of public debt held within the government by agencies or government trust funds such as those for Social Security for periods after 1980. The figure for 2026 reflects the latest estimate from the Congressional Budget Office. Actual results may differ materially from estimates.
13 Gokhale, Jagadeesh, and Kent Smetters. “When Does Federal Debt Reach Unsustainable Levels?” The Penn Wharton Budget Model. October 6, 2023. https://budgetmodel.wharton.upenn.edu/issues/2023/10/6/when-does-federal-debt-reach-unsustainable-levels.
14 Shown are net government debt as a percent of gross domestic product (GDP) figures for the G7 countries. Canada’s net debt excludes social security program funds.
15 Shown is the change in the 10-year U.S. Treasury yield from the start of the year to the latest date shown. Changes in yields are decomposed into three components: inflation expectations, real rates, and term premium. Inflation expectations are estimated using a combination of Treasury Inflation-Protected Securities (TIPS) breakevens and inflation swaps. Real rates are measured as the expected nominal 10-year federal funds rate less inflation expectations. Term premium represents the residual component of the yield. Estimates of term premium are model-dependent and will differ across methodologies.
16 Data shown are the output of Bloomberg’s Sovereign Risk Model, which provides an estimate of the probability of sovereign default based on financial, macroeconomic, and political risk factors. Actual results may differ materially from estimates or projections.
17 Shown is U.S. government debt as a percent of gross domestic product (GDP). U.S. government debt includes publicly held debt and excludes the portion of public debt that is held within the government by agencies or government trust funds such as those for Social Security for periods after 1980. The figure for 2026 reflects the latest estimate from the Congressional Budget Office. The gray region represents projections from the Congressional Budget Office. Actual results may differ materially from projections.
18 Shown are projections for U.S. government debt as a percent of U.S. gross domestic product (GDP), a measure of overall economic activity. U.S. government debt includes publicly held debt and excludes the portion of public debt that is held within the government by agencies or government trust funds such as those for Social Security. Base Case reflects a scenario in which current deficits continue for the next 10 years. Option 1: Spend More/Grow More reflects a scenario in which deficit spending is increased in an effort to accelerate growth. Option 2: Inflate Out of It reflects a scenario in which interest rates are suppressed slightly lower (0.5%) and allows inflation to run slightly higher (0.5%). Option 3: Fiscal Control reflects a scenario in which the primary budget deficit is immediately reduced to 0.5% as a share of GDP. Results are shown solely for illustrative and educational purposes and do not represent actual performance. Hypothetical outcomes may differ materially due to changes in market conditions, assumptions, and other factors.
19 Data shown are projections for U.S. government debt as a percent of U.S. gross domestic product (GDP), a measure of overall economic activity. U.S. government debt includes publicly held debt and excludes the portion of public debt that is held within the government by agencies or government trust funds such as those for Social Security. Base Case reflects a scenario where current deficits continue for the next 10 years. Gradual Fiscal Adjustment reflects a scenario where the Federal Reserve holds rates slightly (0.5%) lower and allows inflation to run slightly (0.5%) higher and the budget deficit is gradually reduced by 0.25% per year as a share of GDP. Results are shown solely for illustrative and educational purposes and do not represent actual performance. Hypothetical outcomes may differ materially due to changes in market conditions, assumptions, and other factors.
20 Plante, Michael, Alexander W. Richter, and Sarah Zubairy, “Revisiting the Interest Rate Effects of Federal Debt,” NBER Working Paper, no. 34018 (2025), https://doi.org/10.3386/w34018.
21 Data shown are projections for U.S. government debt as a percent of U.S. gross domestic product (GDP), a measure of overall economic activity. U.S. government debt includes publicly held debt and excludes the portion of public debt that is held within the government by agencies or government trust funds such as those for Social Security. No Action reflects a scenario where deficits continue with no adjustments. Gradual Fiscal Adjustment reflects a scenario where the Federal Reserve holds rates slightly (0.25%) lower and allows inflation to run slightly (0.25%) higher and the budget deficit is gradually reduced by 0.25% per year as a share of GDP. Each solid line represents a scenario in which that gradual fiscal adjustment is implemented in the year indicated. Results are shown solely for illustrative and educational purposes and do not represent actual performance. Hypothetical outcomes may differ materially due to changes in market conditions, assumptions, and other factors.
22 Shown are yields to worst for various fixed income indices, represented by the following: U.S. Treasuries (Bloomberg U.S. Treasury Bellwethers (10Y)), U.S. Corporate Bonds (Bloomberg U.S. Aggregate Corporate (AA)), Municipal Bonds (Bloomberg Municipal), Mortgage-Backed Securities (Bloomberg U.S. Aggregate Securitized MBS), Global Bonds (Bloomberg Global Aggregate). One cannot invest directly in an index.
23 Bloomberg News, “France’s Debt Is Riskier Than 38% of Nation’s Company Bonds,” October 8, 2026, Bloomberg.
This material is provided solely for informational or educational purposes and is not intended as personalized investment advice. When provided to a client, advice is based on the client’s unique circumstances and may differ substantially from any general recommendations, suggestions, or other considerations included in this material. Any opinions, recommendations, expectations, or projections included herein are subject to change, and any potential outcome discussed, including but not limited to performance, legislation, or tax consequence, ultimately may not occur. Information obtained from third-party sources is assumed to be reliable but may not be independently verified, and the accuracy thereof is not guaranteed. Any company, fund, or security referenced herein is provided solely for illustrative purposes and is not a recommendation to buy, hold, or sell it. Any reference to risk management or risk control does not imply that risk can be eliminated. All investments have risk. Readers should contact Glenmede or consult with a financial, investment, tax, legal, or other advisor if they have any questions about this material or want advice or more information.Foreign stocks may involve special risks not typically associated with U.S. stocks. Foreign investments may be riskier than U.S. investments because of factors such as foreign government restrictions, changes in currency exchange rates, incomplete financial information about the issuers of securities, and political or economic instability, including military hostilities and related sanctions that impact trade and commodity prices. Foreign stocks may be more volatile and less liquid than U.S. stocks.